Can I choose the country that the Browser API will scrape from?
Can I choose the country that the Browser API will scrape from?
**Can I navigate to multiple URLs in a single Browser API session?**Browser API automatically selects the optimal IP type and location for each request using Bright Data’s advanced unblocking capabilities. While it’s possible to specify a location, this is generally not recommended because the automated system ensures the best success for page access.
If you need to launch from a specific country, you can add the-country flag with the appropriate two-letter ISO code after your username in the endpoint. For full instructions and examples, see our location targeting documentation.If you need to target a specific region (not just a country), check out our Proxy.setLocation guide.Which programming languages and tools are fully supported by Browser API?
Which programming languages and tools are fully supported by Browser API?
- Browser API has full, native support for these combinations:
- Node.js: Puppeteer (native), Playwright (native), Selenium WebDriverJS
- Python: Playwright for Python, Selenium WebDriver for Python
- Java: Playwright for Java, Selenium WebDriver for Java
- C# (.NET): Playwright for .NET, Selenium WebDriver for .NET
How can I use Browser API with other languages and tools?
How can I use Browser API with other languages and tools?
- Browser API can also be integrated with other languages using community or third-party libraries:
- Java: Puppeteer Java
- Ruby: Puppeteer-Ruby, playwright-ruby-client, Selenium WebDriver for Ruby
- Go: chromedp, playwright-go, Selenium WebDriver for Go
- For languages not listed, integration is possible if the library supports remote Chrome DevTools Protocol or WebDriver.
How do I see the status of the captcha?
How do I see the status of the captcha?
How can I debug what's happening behind the scenes during my Browser API session?
How can I debug what's happening behind the scenes during my Browser API session?
Where do I find the Browser API Debugger?
The Browser API Debugger can be launched via two methods:- Manually via Control Panel
-
Remotely via your script.
Leveraging Chrome Dev Tools
- via Control Panel
- via Code (remote)
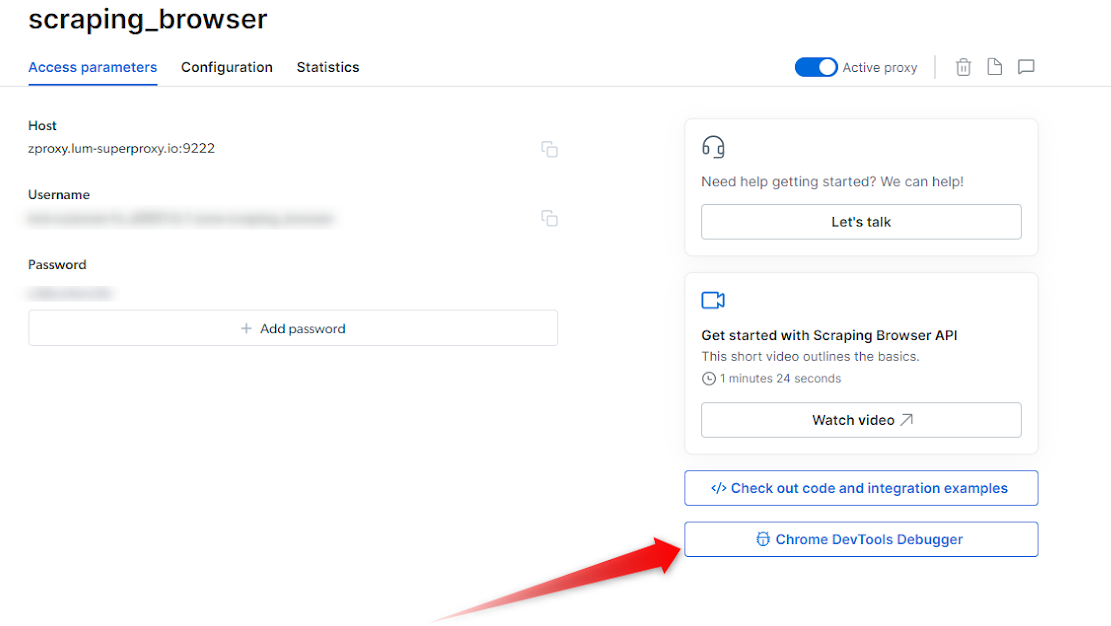
The Browser API Debugger can be easily accessed within your Bright Data Control Panel. Follow these steps:- Within the control panel, go to My Proxies view
- Click on your Browser API proxy
- Click on the Overview tab
-
On the right side, Click on the “Chrome Dev Tools Debugger” button
Open a Browser API Session
- Ensure you have an active Browser API session
- If you don’t yet know how to launch a Browser API session, see our Quick Start guide.
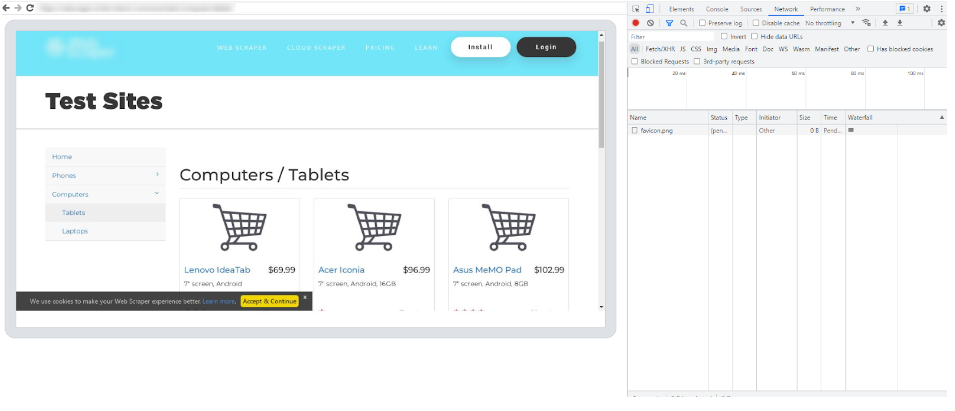
Launch the Debugger
- Once your session is up and running you can now launch the Debugger.
- Click on the Debugger button within your Overview tab to launch the Browser API Debugger interface (see the screenshot above )
Connect with your live browser sessions
- Within the Debugger interface, you will find a list of your live Browser API sessions.
- Select the preferred session that you wish to debug
- Click on the session link or copy/paste it into your browser of choice, and this will establish a connection between the Debugger and your selected session.
- With the Browser API Debugger now connected to your live session, you gain access to the powerful features of Chrome Dev Tools.
- Utilize the Dev Tools interface to inspect HTML elements, analyze network requests, debug JavaScript code, and monitor performance. Leverage breakpoints, console logging, and other debugging techniques to identify and resolve issues within your code.
How to automatically launch devtools locally to view your live browser session?
How to automatically launch devtools locally to view your live browser session?
How can I get a screenshot of what's happening in the browser?
How can I get a screenshot of what's happening in the browser?
- Triggering a screenshot
- Launch devtools locally
Why does the initial navigation for certain pages take longer than others?
Why does the initial navigation for certain pages take longer than others?
What are the most Common Error codes?
What are the most Common Error codes?
| Error Code | Meaning | What can you do about it? |
| Unexpected server response: 407 | An issue with the remote browser’s port | Please check your remote browser’s port. The correct port for Browser API is port:9222 |
| Unexpected server response: 403 | Authentication Error | Check authentication credentials (username, password) and check that you are using the correct “Browser API” zone from Bright Data control panel |
| Unexpected server response: 503 | Service Unavailable | We are likely scaling browsers right now to meet demand. Try to reconnect in 1 minute. |
I can't seem to establish a connection with Browser API, do I have a connection issue?
I can't seem to establish a connection with Browser API, do I have a connection issue?
If a JSON is returned within the response:
- Your authentication and connection to Browser API are successful. Confirm you are using these exact configurations in your script.
- If you are still facing issues connecting to Browser API, contact support for further assistance.
If a JSON is not returned within the response:
- Check your authentication details from your Browser API zone, and ensure the USER and PASS values are correct.
- Verify network Configuration: Confirm your network and/or firewall is not blocking outbound connections to
https://brd.superproxy.io:9222. - If the issue persists, please contact support for further assistance.
How to Integrate Browser API with .NET Puppeteer Sharp?
How to Integrate Browser API with .NET Puppeteer Sharp?
How does the Browser API pricing work?
How does the Browser API pricing work?
How do I reduce data and bandwidth consumption with Browser API?
How do I reduce data and bandwidth consumption with Browser API?
- Block unnecessary resources such as images, stylesheets, and ads using request interception or CDP custom functions
- Take advantage of browser caching
- Follow best practices for request management
For instructions and code on blocking ads using CDP custom functions, see our custom Ad Blocker.
Is password typing allowed with Browser API?
Is password typing allowed with Browser API?
How can I keep the same IP address in Browser API sessions?
How can I keep the same IP address in Browser API sessions?
What’s the difference between integrating a proxy with automation scripts and using the Browser API?
What’s the difference between integrating a proxy with automation scripts and using the Browser API?
- You set up proxies directly in your own scripts using tools like Puppeteer, Playwright, or Selenium.
- You manage everything: browser setup, sessions, scaling, anti-bot challenges (CAPTCHAs, fingerprints, headers, etc.).
- Offers full control and flexibility, but you’re responsible for maintaining and troubleshooting all aspects—including unblocking and scalability.
- You connect your automation scripts to a managed browser running in Bright Data’s cloud.
- Bright Data handles infrastructure, scaling, anti-bot/unblocking (CAPTCHAs, fingerprints, etc.), and proxy rotation.
- You focus only on your scraping logic. It’s easier to scale, especially for complex interactive sites.
- Ideal if you want powerful scraping without the need to maintain or build your own anti-bot solutions.
How to make scraping faster with Browser API?
How to make scraping faster with Browser API?
How do I know what type of proxies the Browser API is using?
How do I know what type of proxies the Browser API is using?
How do I connect to Browser API with Playwright, Puppeteer, or Selenium?
How do I connect to Browser API with Playwright, Puppeteer, or Selenium?
- For Playwright and Puppeteer, connect using a WebSocket (
wss://) endpoint with the hostbrd.superproxy.ioand port9222.- Example connection URL:
wss://${AUTH}@brd.superproxy.io:9222
- Example connection URL:
- For Selenium, connect using an HTTPS endpoint with the host
brd.superproxy.ioand port9515.- Example connection URL:
https://${AUTH}@brd.superproxy.io:9515
- Example connection URL:
Proxy vs. Browser API, what’s the difference and which endpoint do I use?
Proxy vs. Browser API, what’s the difference and which endpoint do I use?
- Regular Proxy Network: you launch your own browser/process and route traffic through
brd.superproxy.io:33335, authenticating withbrd-customer-<CID>-zone-<ZONE>:<PASSWORD>. - Browser API (formerly Scraping Browser): Bright Data spins up a managed, cloud Chrome for you. You do not start
puppeteer.launch(). Instead, you attach to the remote browser:
Can I navigate to multiple URLs in a single Browser API session?
Can I navigate to multiple URLs in a single Browser API session?